Chapter 8 Supp figure 2
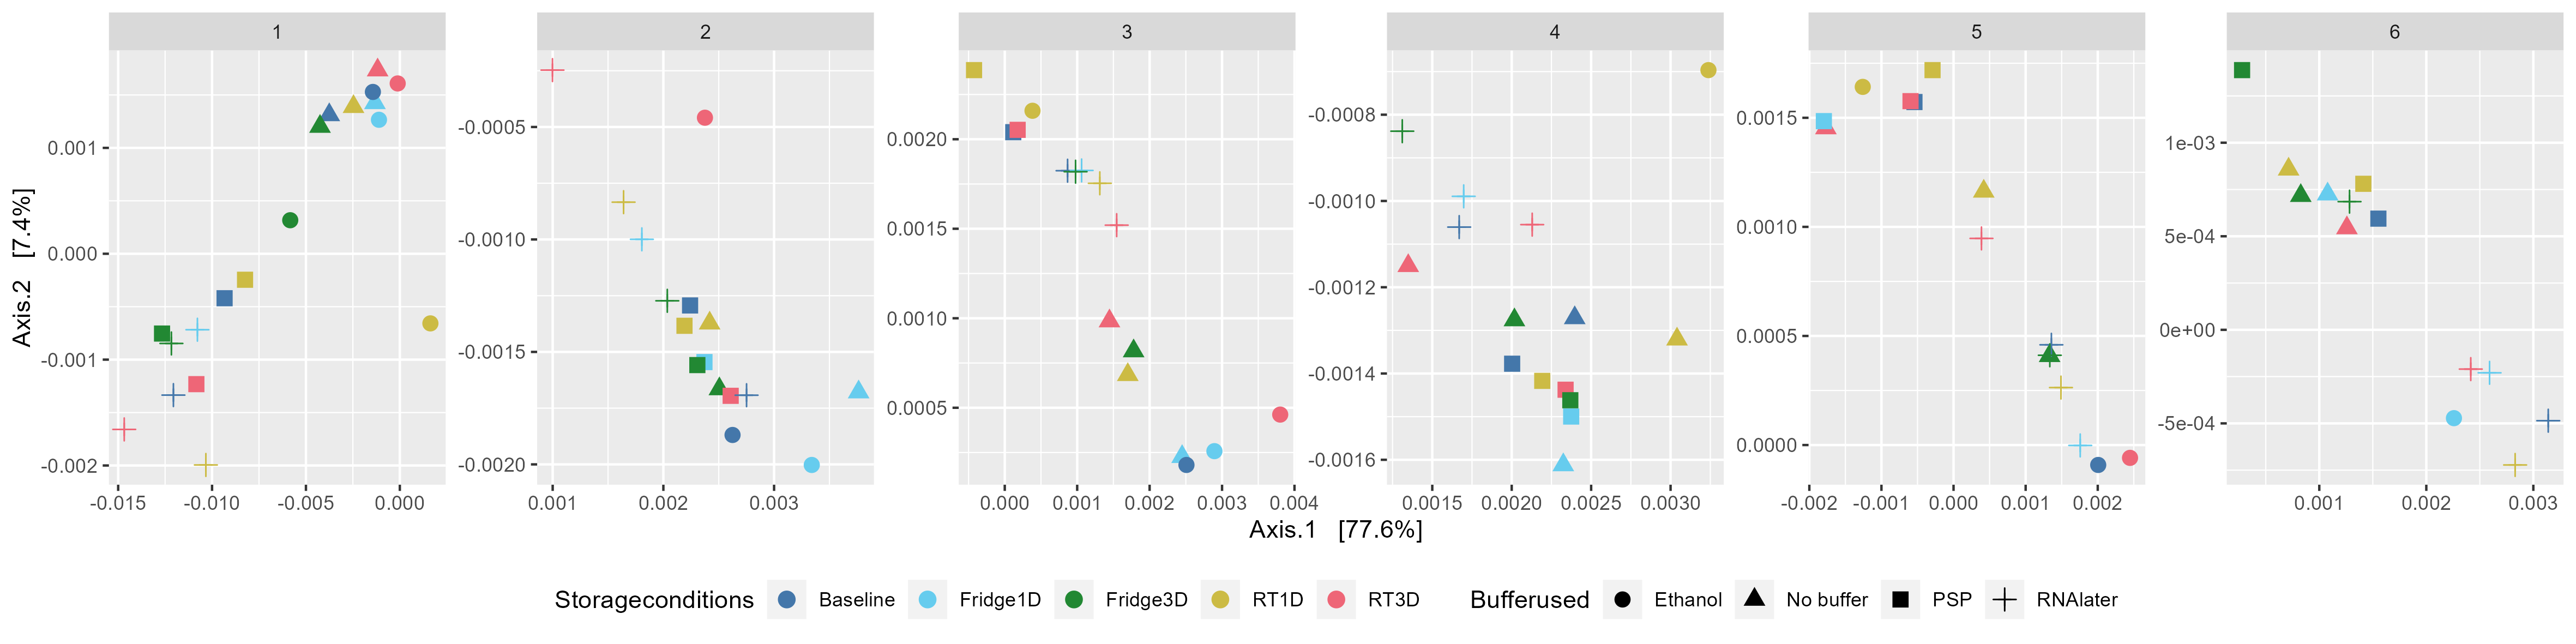
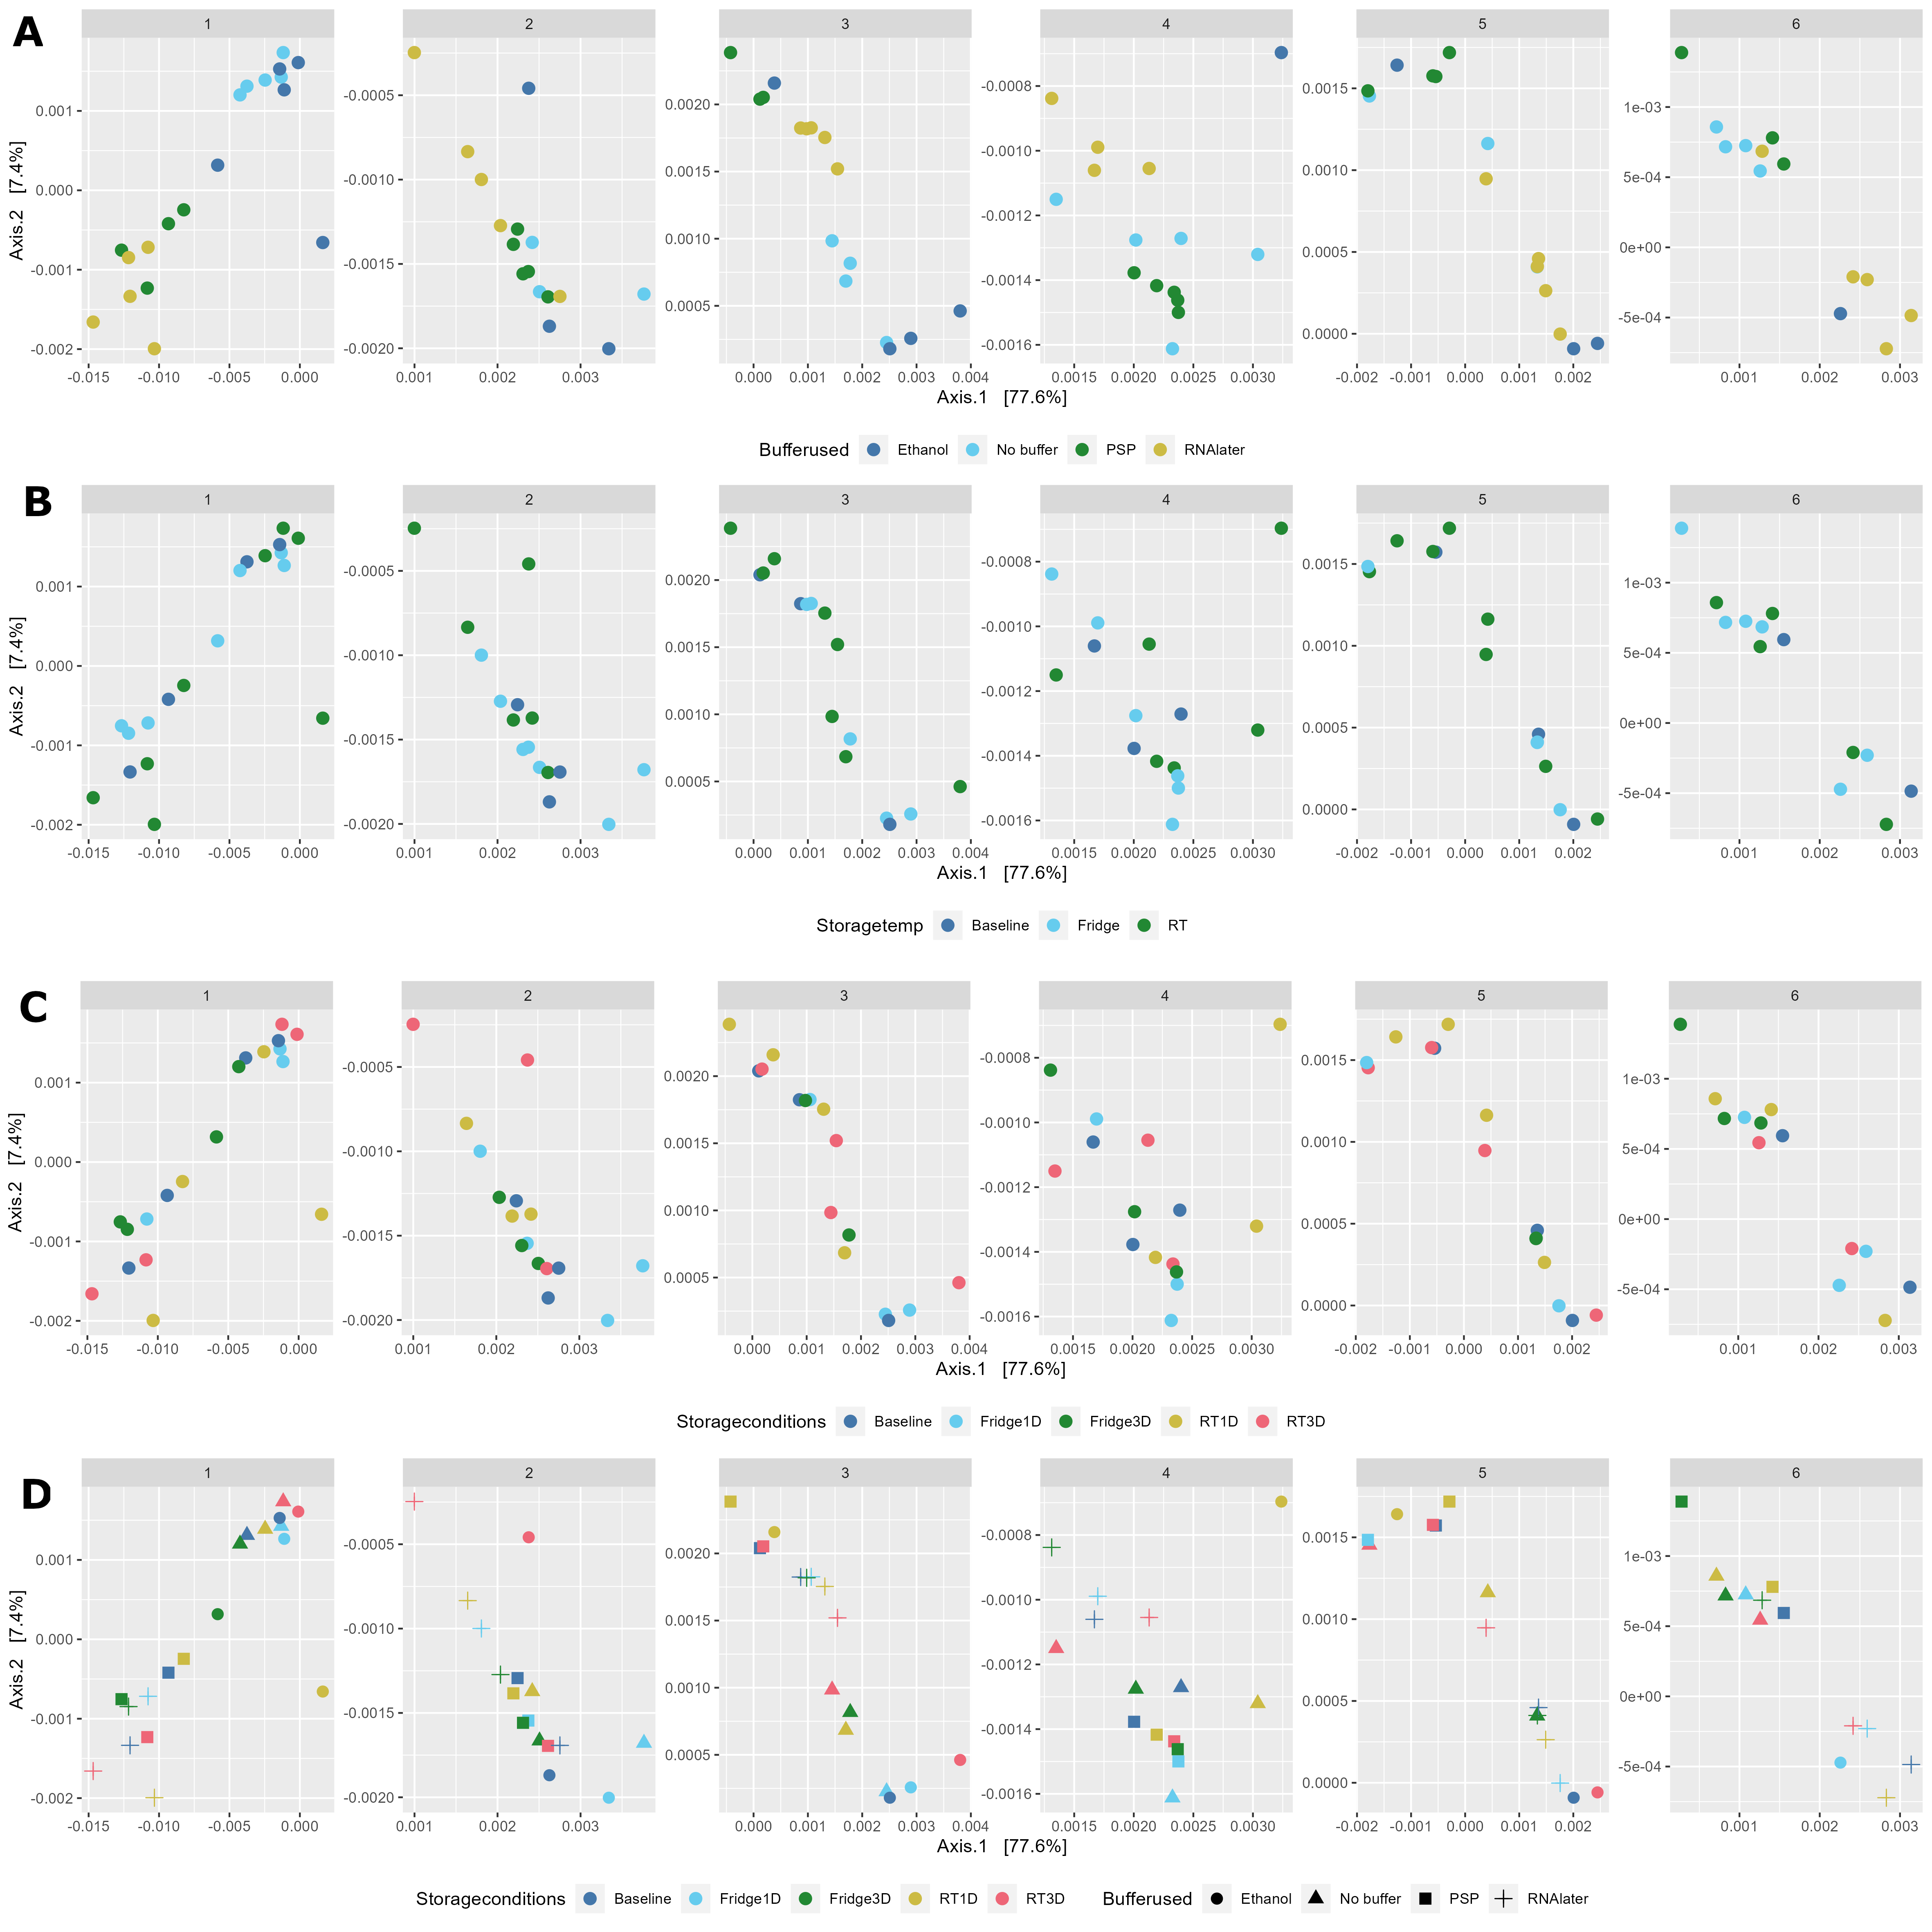
Principal component analysis (PCoA) of stool microbiota composition presented per participant (1–6). Data was stratified based on (A) buffer used, (B) storage temperature, (C) storage condition, and (D) dual stratification by buffer used and storage condition. Analysis was undertaken using species-level classification data after ASV-based analysis.
8.2 Weighted unifrac plots with relative abundance
Create the ordination data
## Warning in matrix(tree$edge[order(tree$edge[, 1]), ][, 2], byrow = TRUE, : data length [7917]
## is not a sub-multiple or multiple of the number of rows [3959]
8.2.1 Figure A: Buffer used faceted by patient
p <-  plot_ordination(physeq, ord,
                      color="Bufferused") +
    geom_point(size=3) +
  facet_wrap(~Patientnumber, nrow = 1, scales = "free") +
    theme(legend.position="bottom")+
  scale_color_manual(values=tol_pal)
ggsave(plot = p,
       "./figures/weighted_unifrac_Bufferused_facet_patient.png",
       device = "png", units = "mm", height = 100, width = 400)
8.2.2 Figure B: Storage temperature
p <-  plot_ordination(physeq, ord,
                      color="Storagetempcategory")+
      geom_point(size=3) +
  facet_wrap(~Patientnumber, nrow = 1, scales = "free") +
    theme(legend.position="bottom") +
  labs(color='Storagetemp') +
  scale_color_manual(values=tol_pal)
ggsave(plot = p,
       "./figures/weighted_unifrac_Storagetemp_facet_patient.png",
       device = "png", units = "mm", height = 100, width = 400)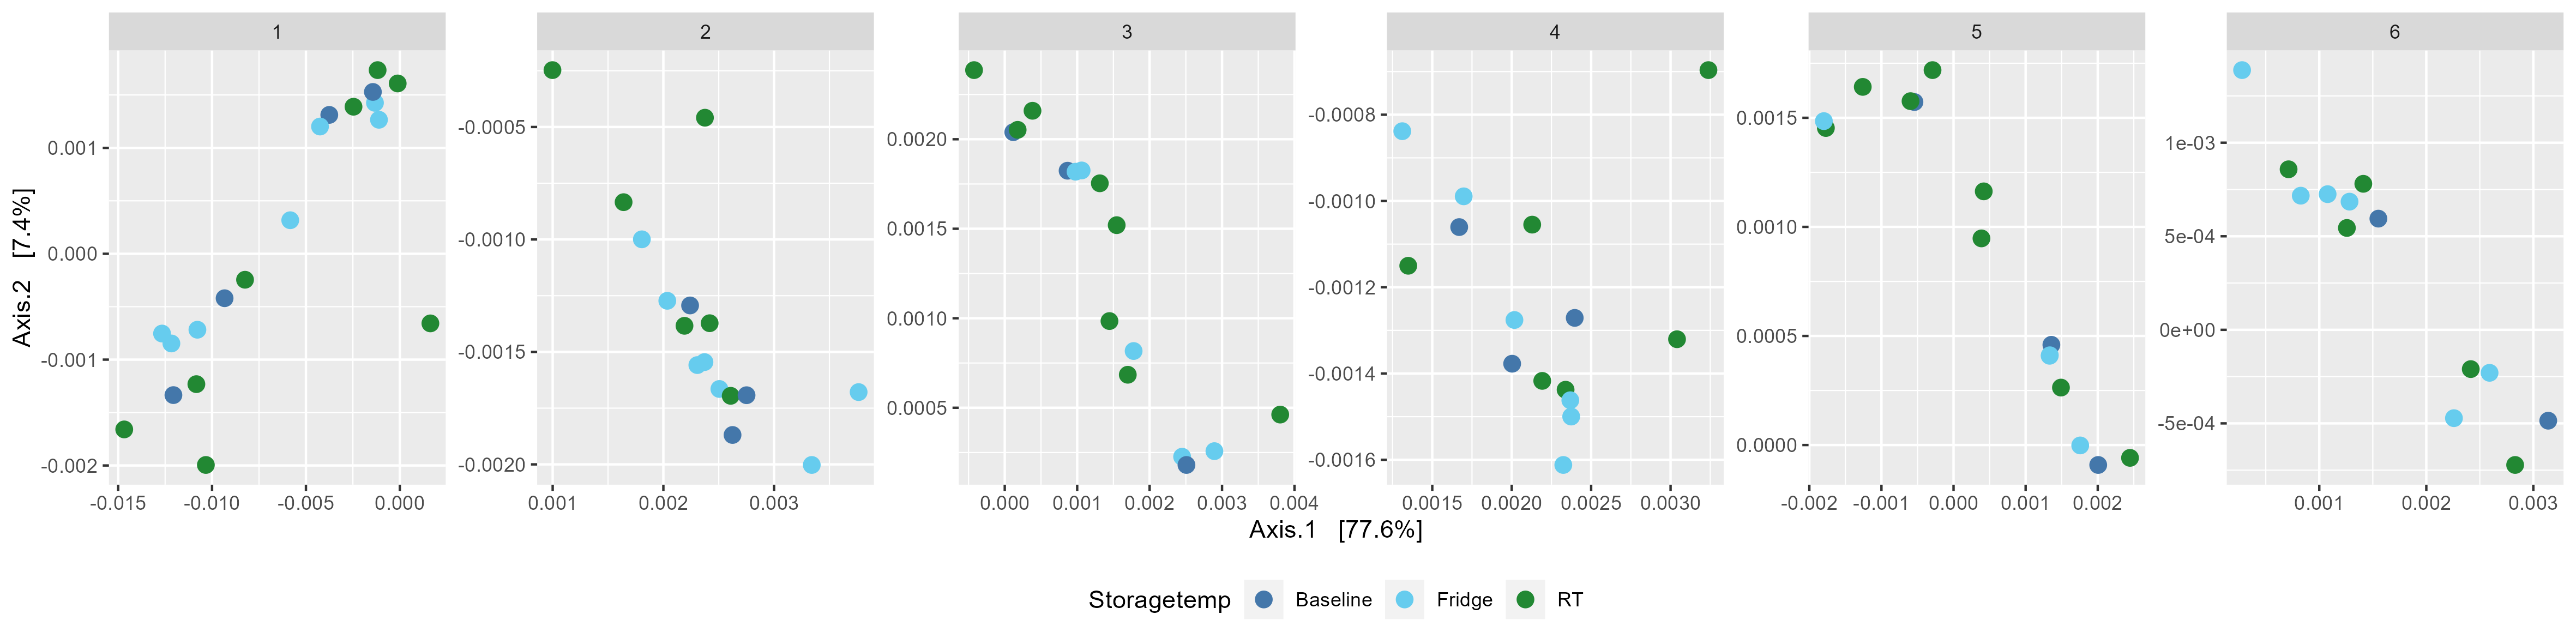
8.2.3 Figure C: Storage conditions
p <-  plot_ordination(physeq, ord,
                      color="Storageconditions") +
      geom_point(size=3) +
  facet_wrap(~Patientnumber, nrow = 1, scales = "free") +
    theme(legend.position="bottom")+
  scale_color_manual(values=tol_pal)
ggsave(plot = p,
       "./figures/weighted_unifrac_Storageconditions_facet_patient.png",
       device = "png", units = "mm", height = 100, width = 400)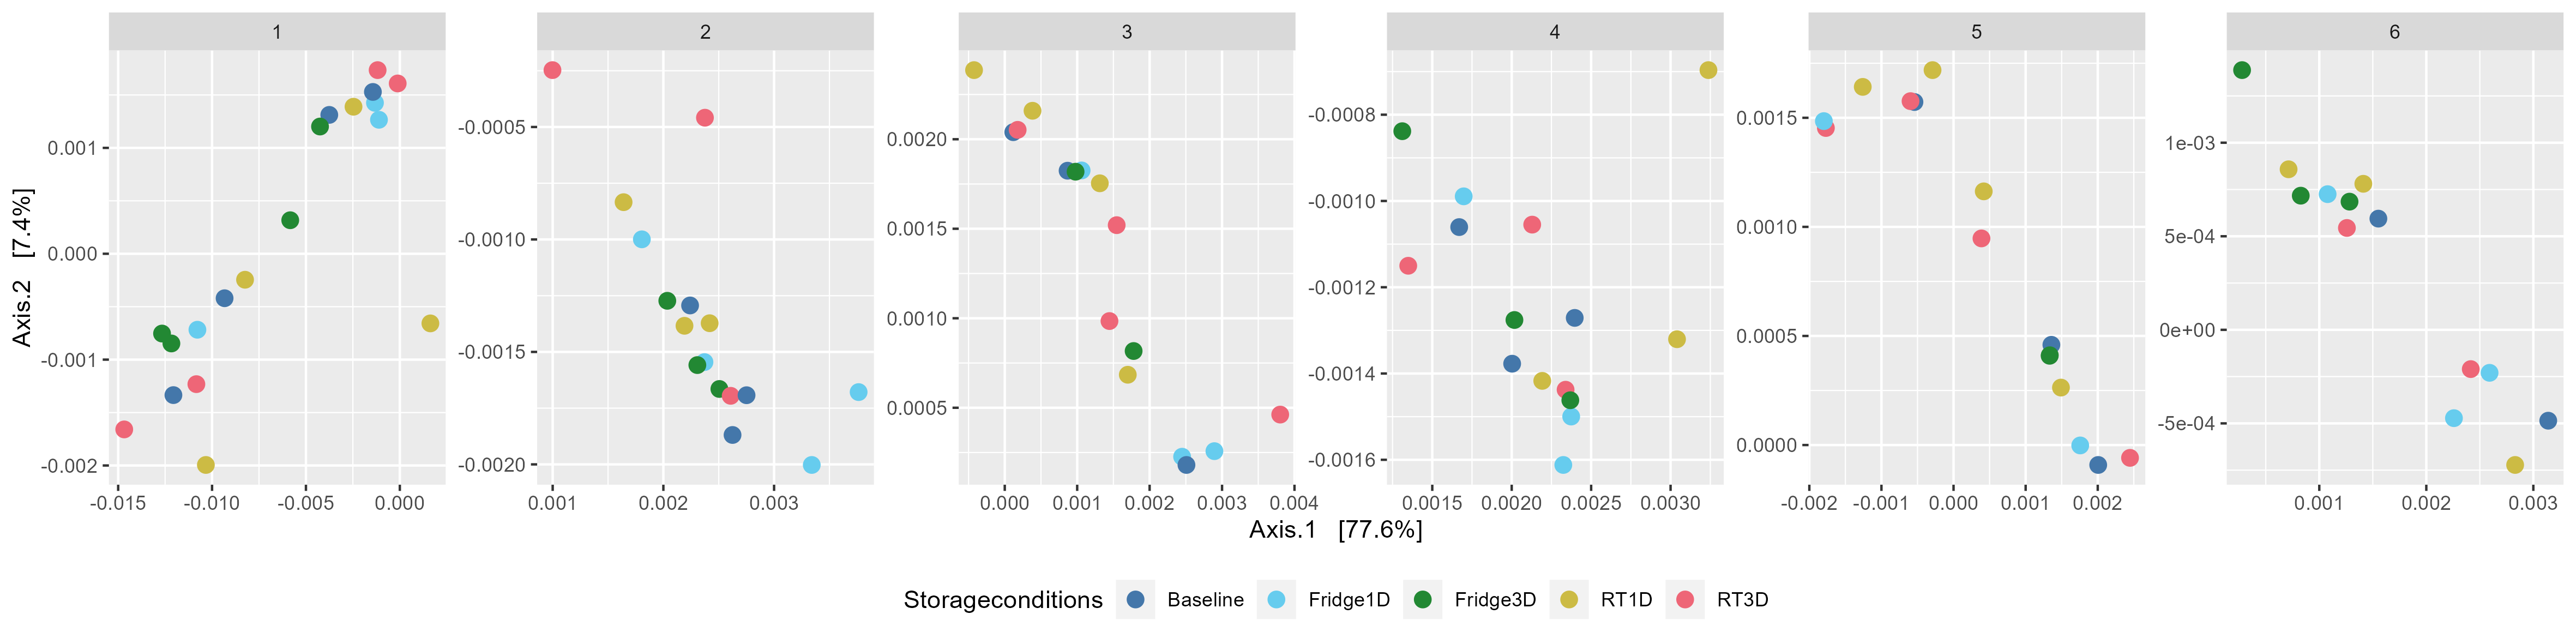
8.2.4 Figure D: Buffer and storage condition faceted by patient
p <-  plot_ordination(physeq, ord,
                      color="Storageconditions", shape = "Bufferused")+
      geom_point(size=3) +
  facet_wrap(~Patientnumber, nrow = 1, scales = "free") +
    theme(legend.position="bottom")+
  scale_color_manual(values=tol_pal)
ggsave(plot = p,
       "./figures/weighted_unifrac_Bufferused_and_Storageconditions_facet_patient.png",
       device = "png", units = "mm", height = 100, width = 400)