Chapter 10 Supp figure 4
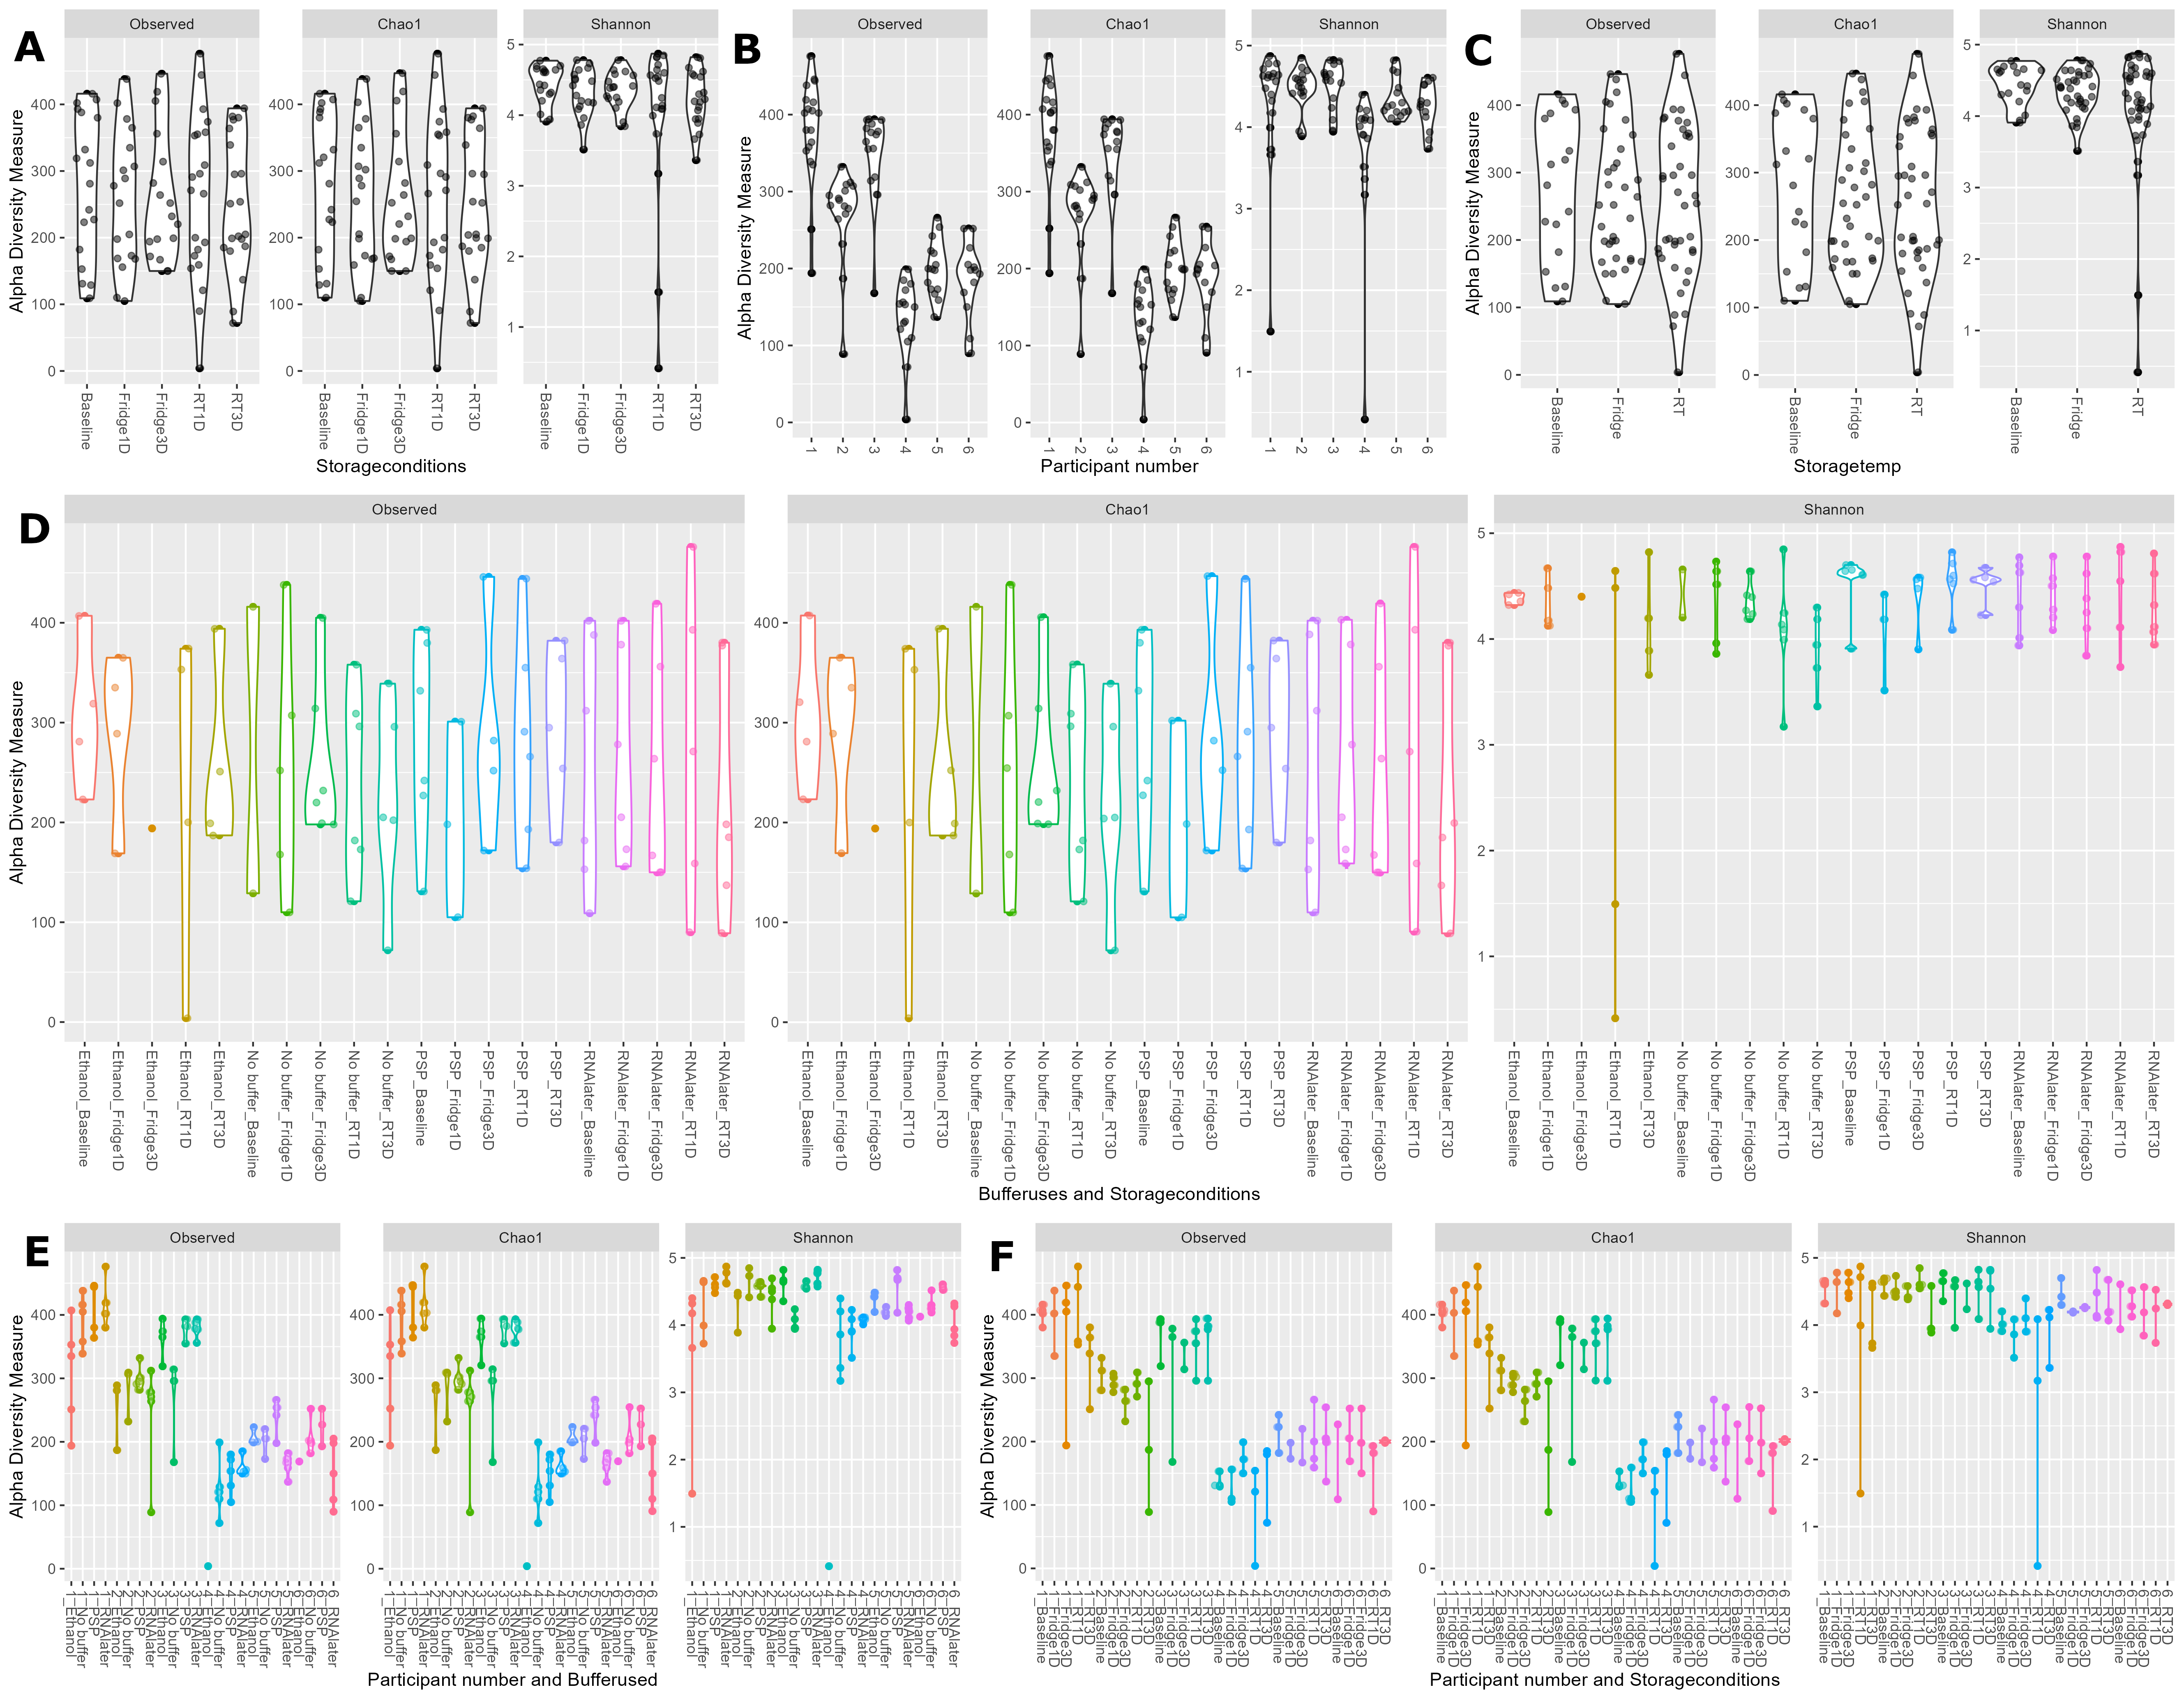
Alpha diversity (observed species, chao1 and Shannon) of the 16S ASV based microbiota data of stool samples stratified by (A) storage condition, (B) patient, (C) storage temperature, (D) dual stratification by buffer used and storage condition, (E) dual stratification by patient number and buffer used, and (F) dual stratification by patient number and storage condition.
10.1 Libraries
Change some metadata categories
#Change -80 to baseline in storage conditions
sample_data(physeq)[,"Storageconditions"] <- gsub(
  pattern = "-80", replacement = "Baseline",
  x = as.vector(unlist(sample_data(physeq)[,"Storageconditions"]))
)
#Storage temp change to categorical names
sample_data(physeq)[,"Storagetemp"] <- gsub(
  pattern = "-80", replacement = "Baseline",
  x = as.vector(unlist(sample_data(physeq)[,"Storagetemp"]))
)
sample_data(physeq)[,"Storagetemp"] <- gsub(
  pattern = "4", replacement = "Fridge",
  x = as.vector(unlist(sample_data(physeq)[,"Storagetemp"]))
)
sample_data(physeq)[,"Storagetemp"] <- gsub(
  pattern = "20", replacement = "RT",
  x = as.vector(unlist(sample_data(physeq)[,"Storagetemp"]))
)
#Bufferused_and_Storageconditions change to categorical names
sample_data(physeq)[,"Bufferused_and_Storageconditions"] <- gsub(
  pattern = "-80", replacement = "Baseline",
  x = as.vector(unlist(sample_data(physeq)[,"Bufferused_and_Storageconditions"]))
)
sample_data(physeq)[,"Bufferused_and_Storageconditions"] <- gsub(
  pattern = "4", replacement = "Fridge",
  x = as.vector(unlist(sample_data(physeq)[,"Bufferused_and_Storageconditions"]))
)
sample_data(physeq)[,"Bufferused_and_Storageconditions"] <- gsub(
  pattern = "20", replacement = "RT",
  x = as.vector(unlist(sample_data(physeq)[,"Bufferused_and_Storageconditions"]))
)
10.2 Alpha diveristy plots
10.2.1 A: Storage conditions
p <- plot_richness(physeq, x = "Storageconditions",
                   measures = c("Observed","Chao1","Shannon")) +
  geom_violin() +
  ggforce::geom_sina(alpha=0.5)
ggsave(plot = p,
       filename = "./figures/alpha_diversity_Storageconditions.png",
       device = "png", units = "mm", height = 100, width = 150)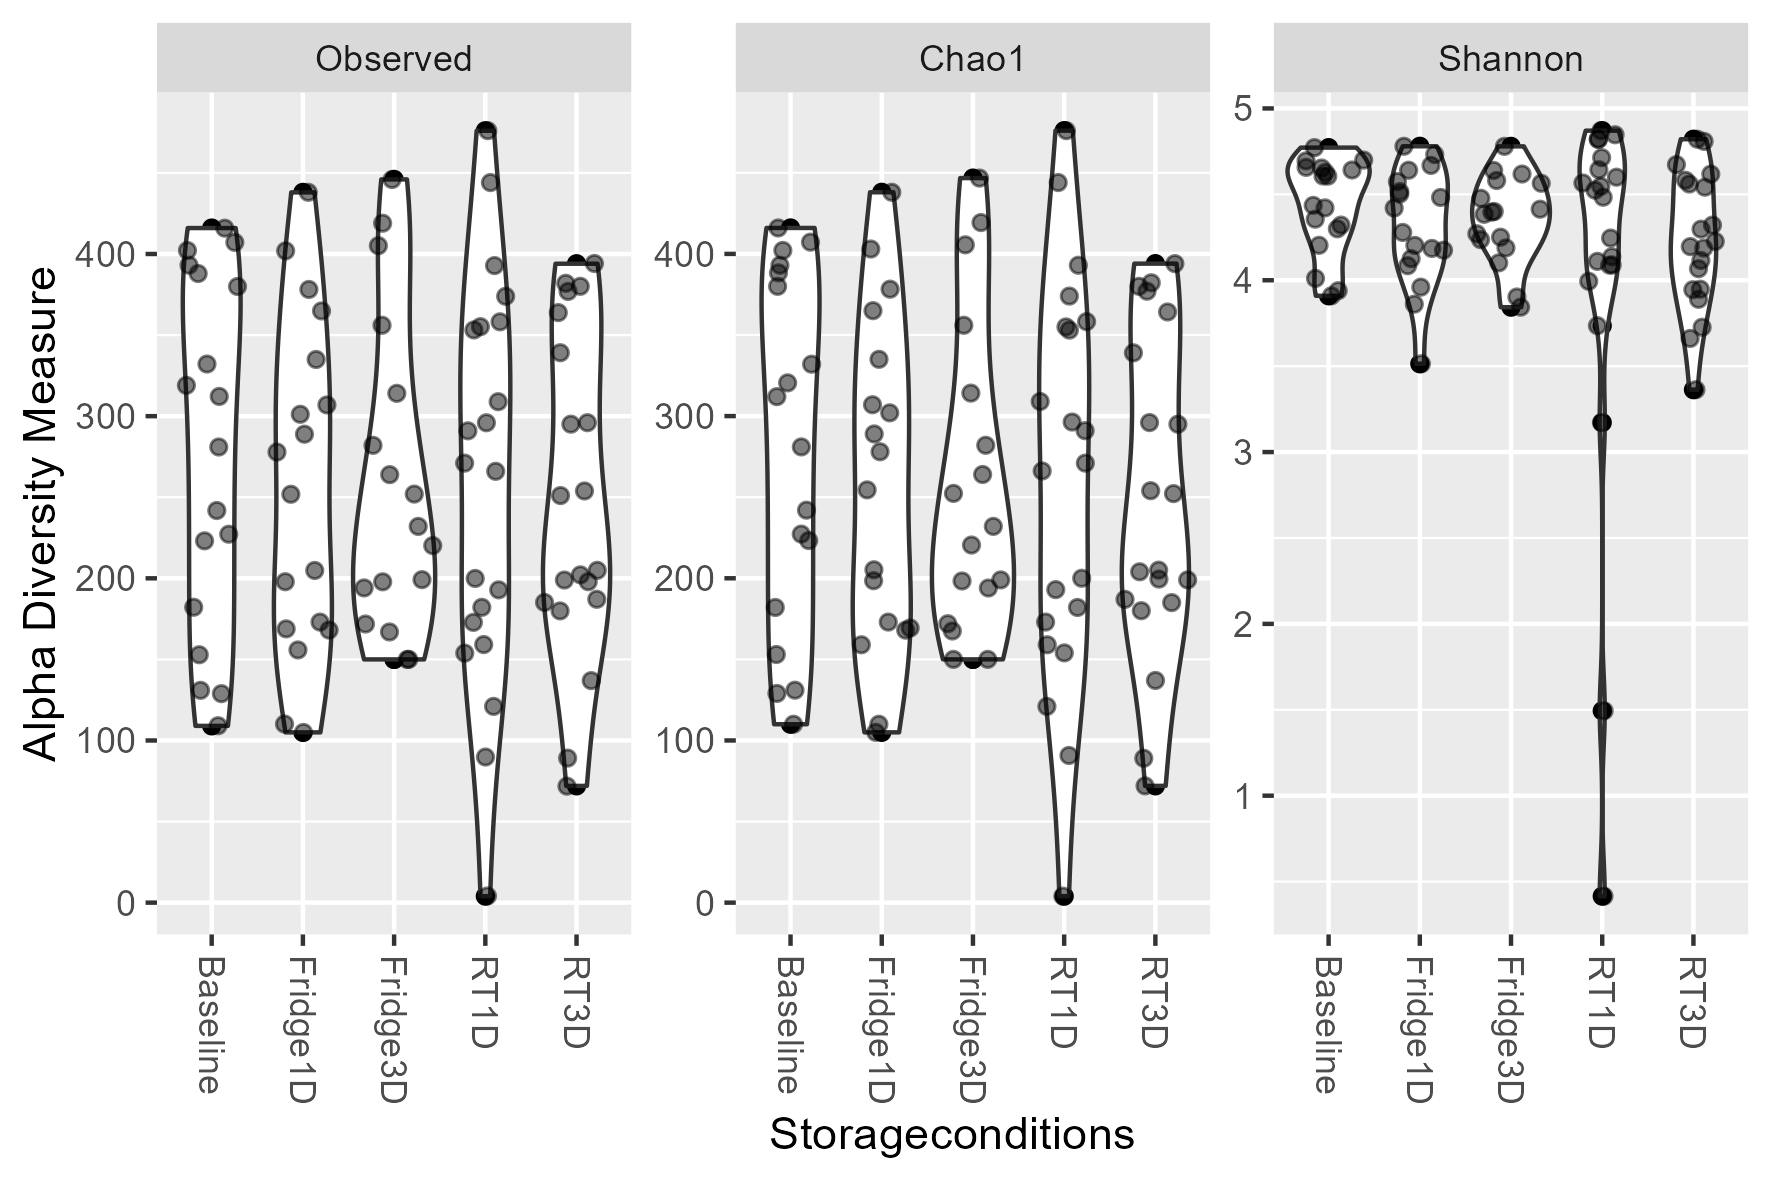
10.2.2 B: Participant number
p <- plot_richness(physeq, x = "Patientnumber",
                   measures = c("Observed","Chao1","Shannon")) +
  geom_violin() +
  ggforce::geom_sina(alpha=0.5) +
  xlab("Participant number")
ggsave(plot = p,
       filename = "./figures/alpha_diversity_patient.png",
       device = "png", units = "mm", height = 100, width = 150)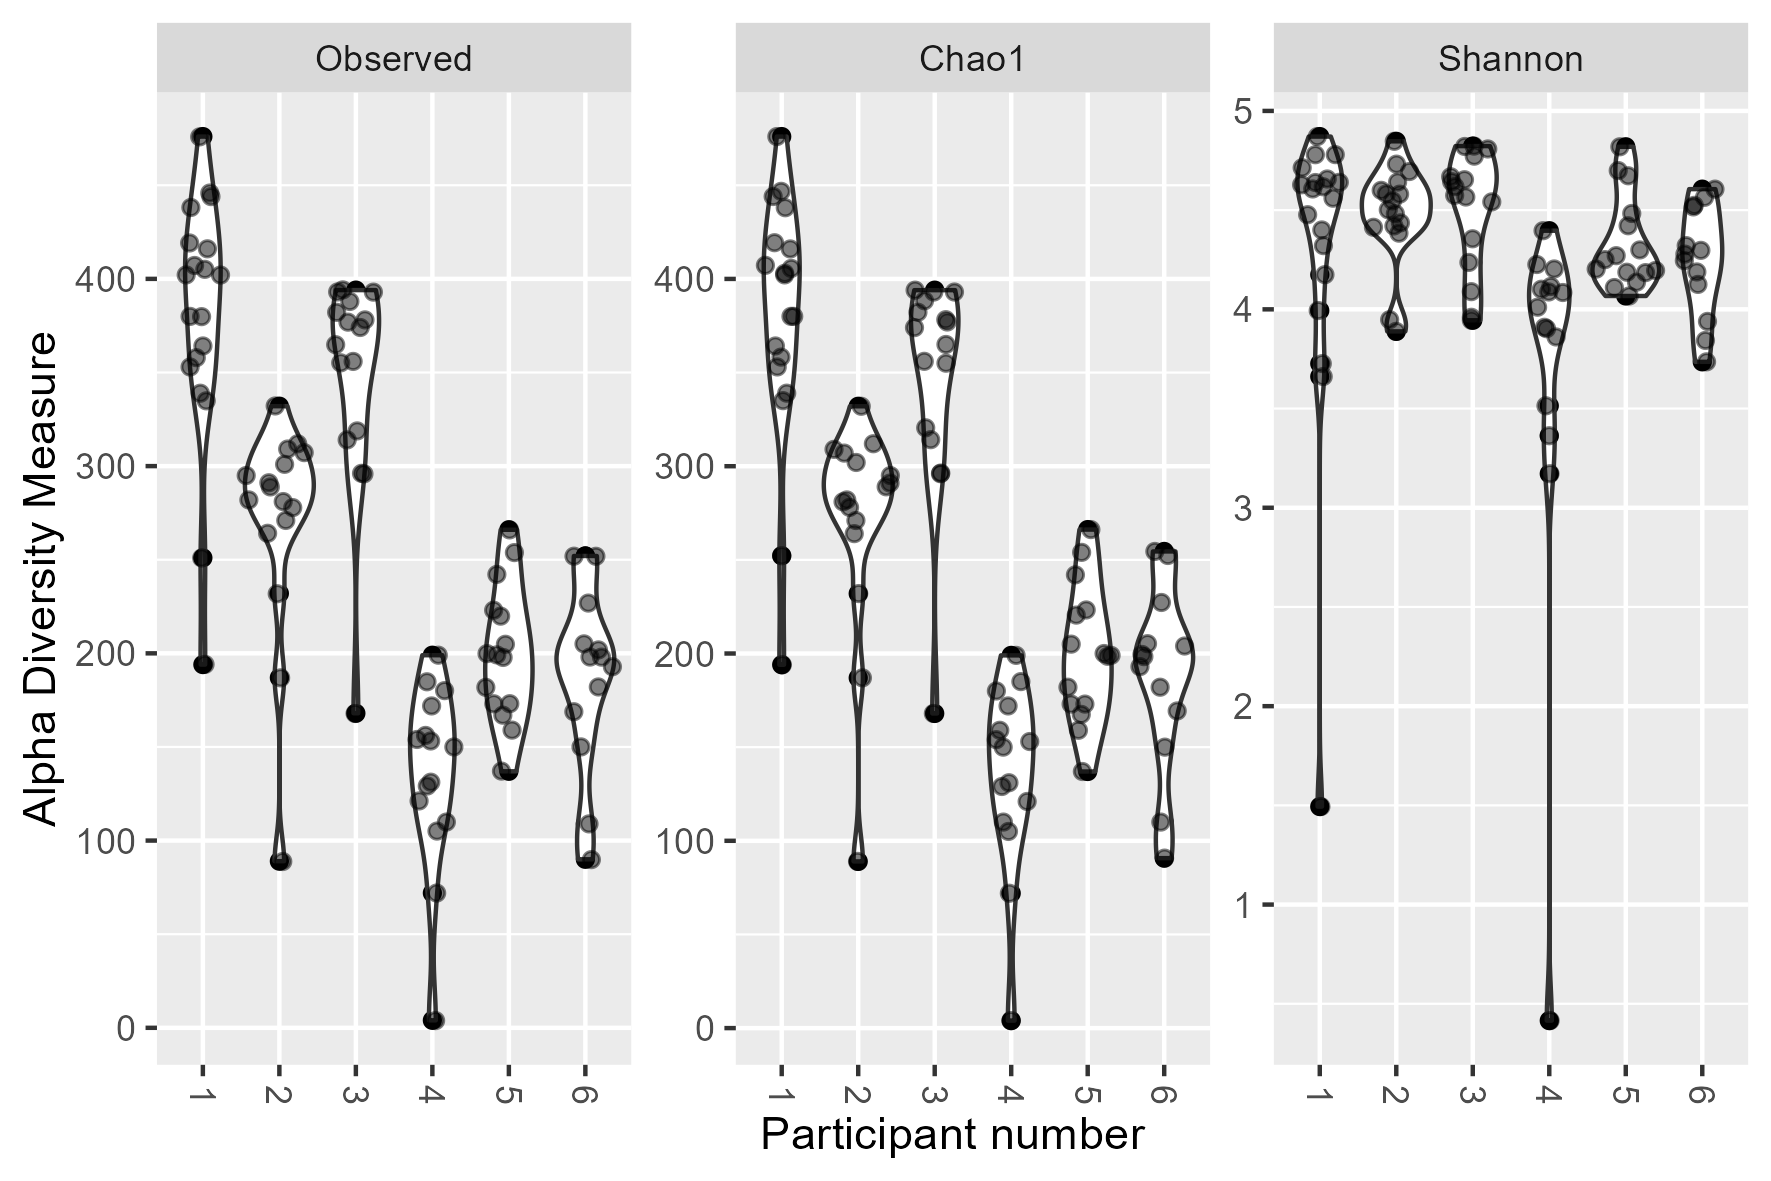
10.2.3 C: Storage temp
p <- plot_richness(physeq, x = "Storagetemp",
                   measures = c("Observed","Chao1","Shannon")) +
  geom_violin() +
  ggforce::geom_sina(alpha=0.5)
ggsave(plot = p,
       filename = "./figures/alpha_diversity_Storagetemp.png",
       device = "png", units = "mm", height = 100, width = 150)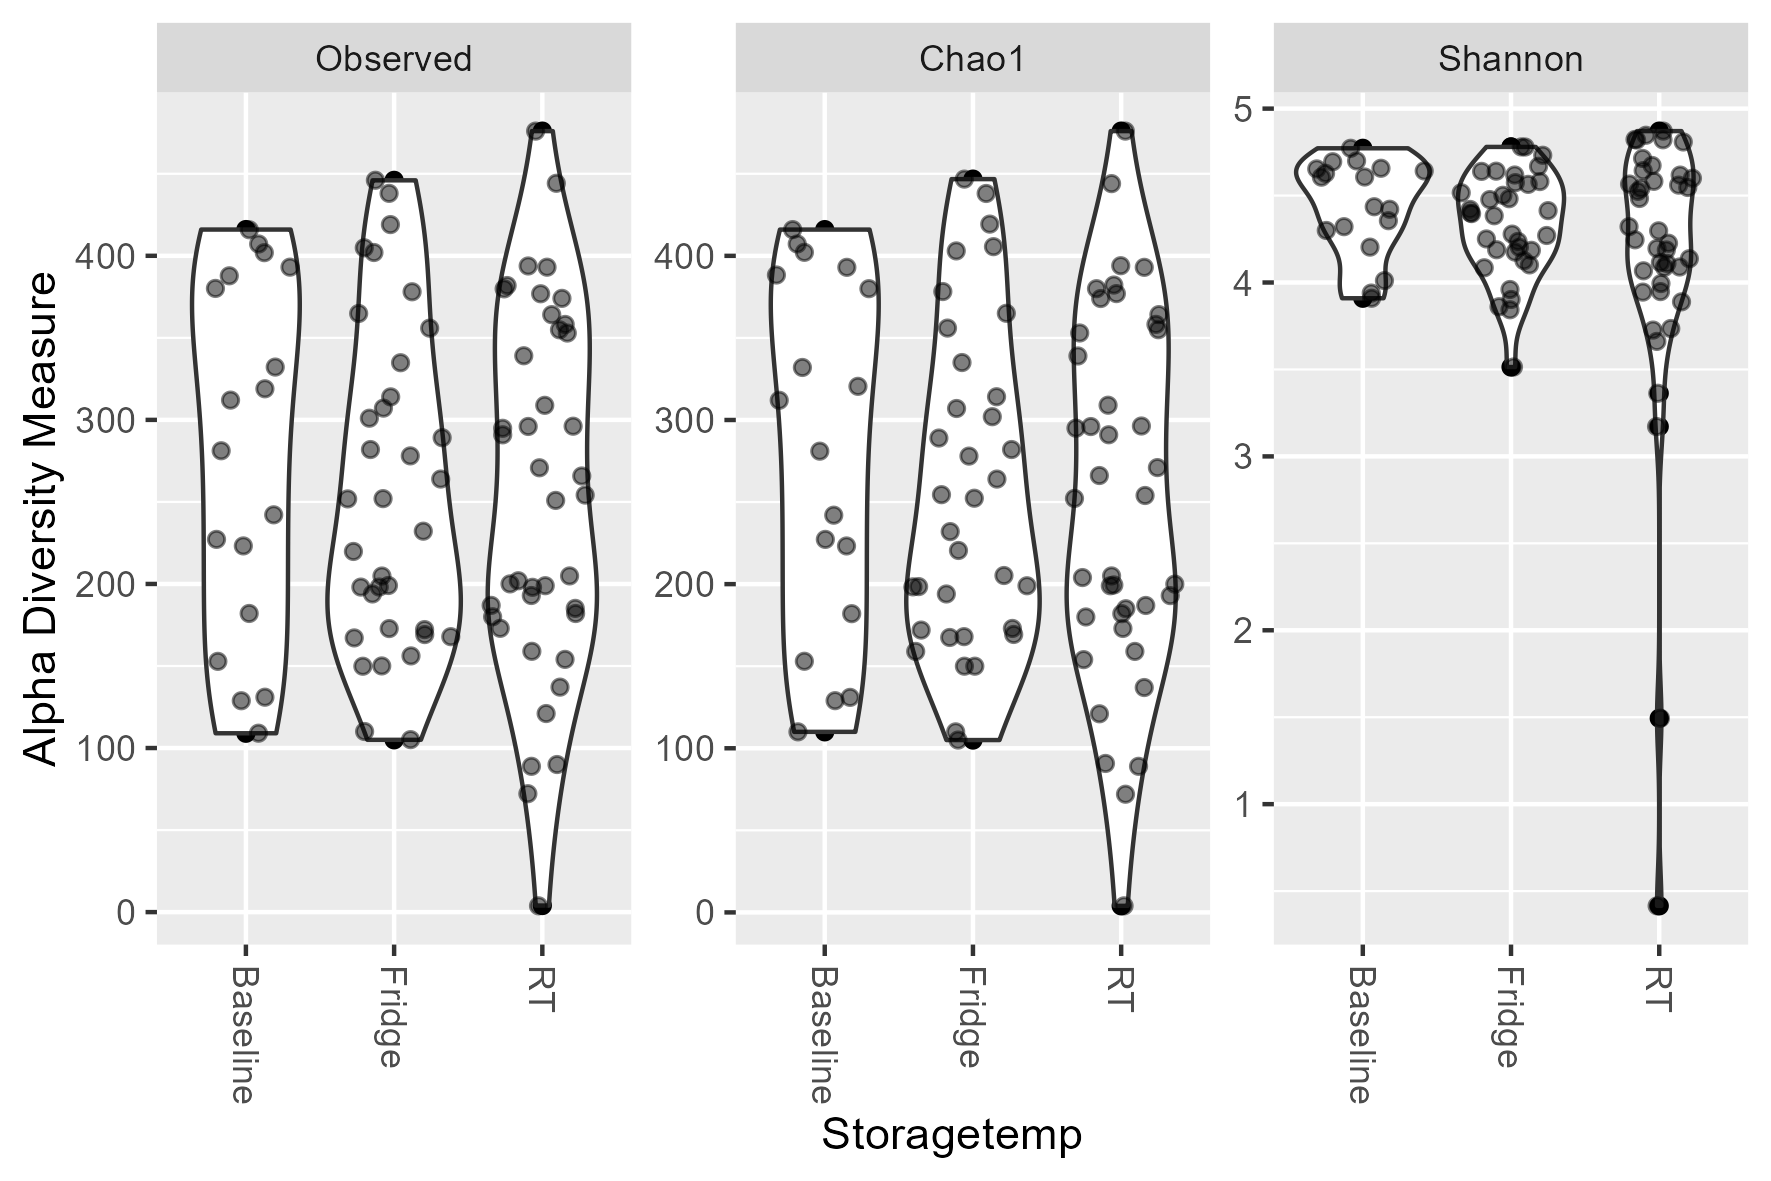
10.2.4 D: Buffer and storage
p <- plot_richness(physeq, x = "Bufferused_and_Storageconditions",
                   color="Bufferused_and_Storageconditions",
                   measures = c("Observed","Chao1","Shannon")) +
  geom_violin() +
  ggforce::geom_sina(alpha=0.5) +
   theme(legend.position="none") +
  xlab("Bufferused and Storageconditions")
#  geom_point(size = 3)
ggsave(plot = p,
       filename = "./figures/alpha_diversity_Bufferused_and_Storageconditions.png",
       device = "png", units = "mm", height = 150, width = 450)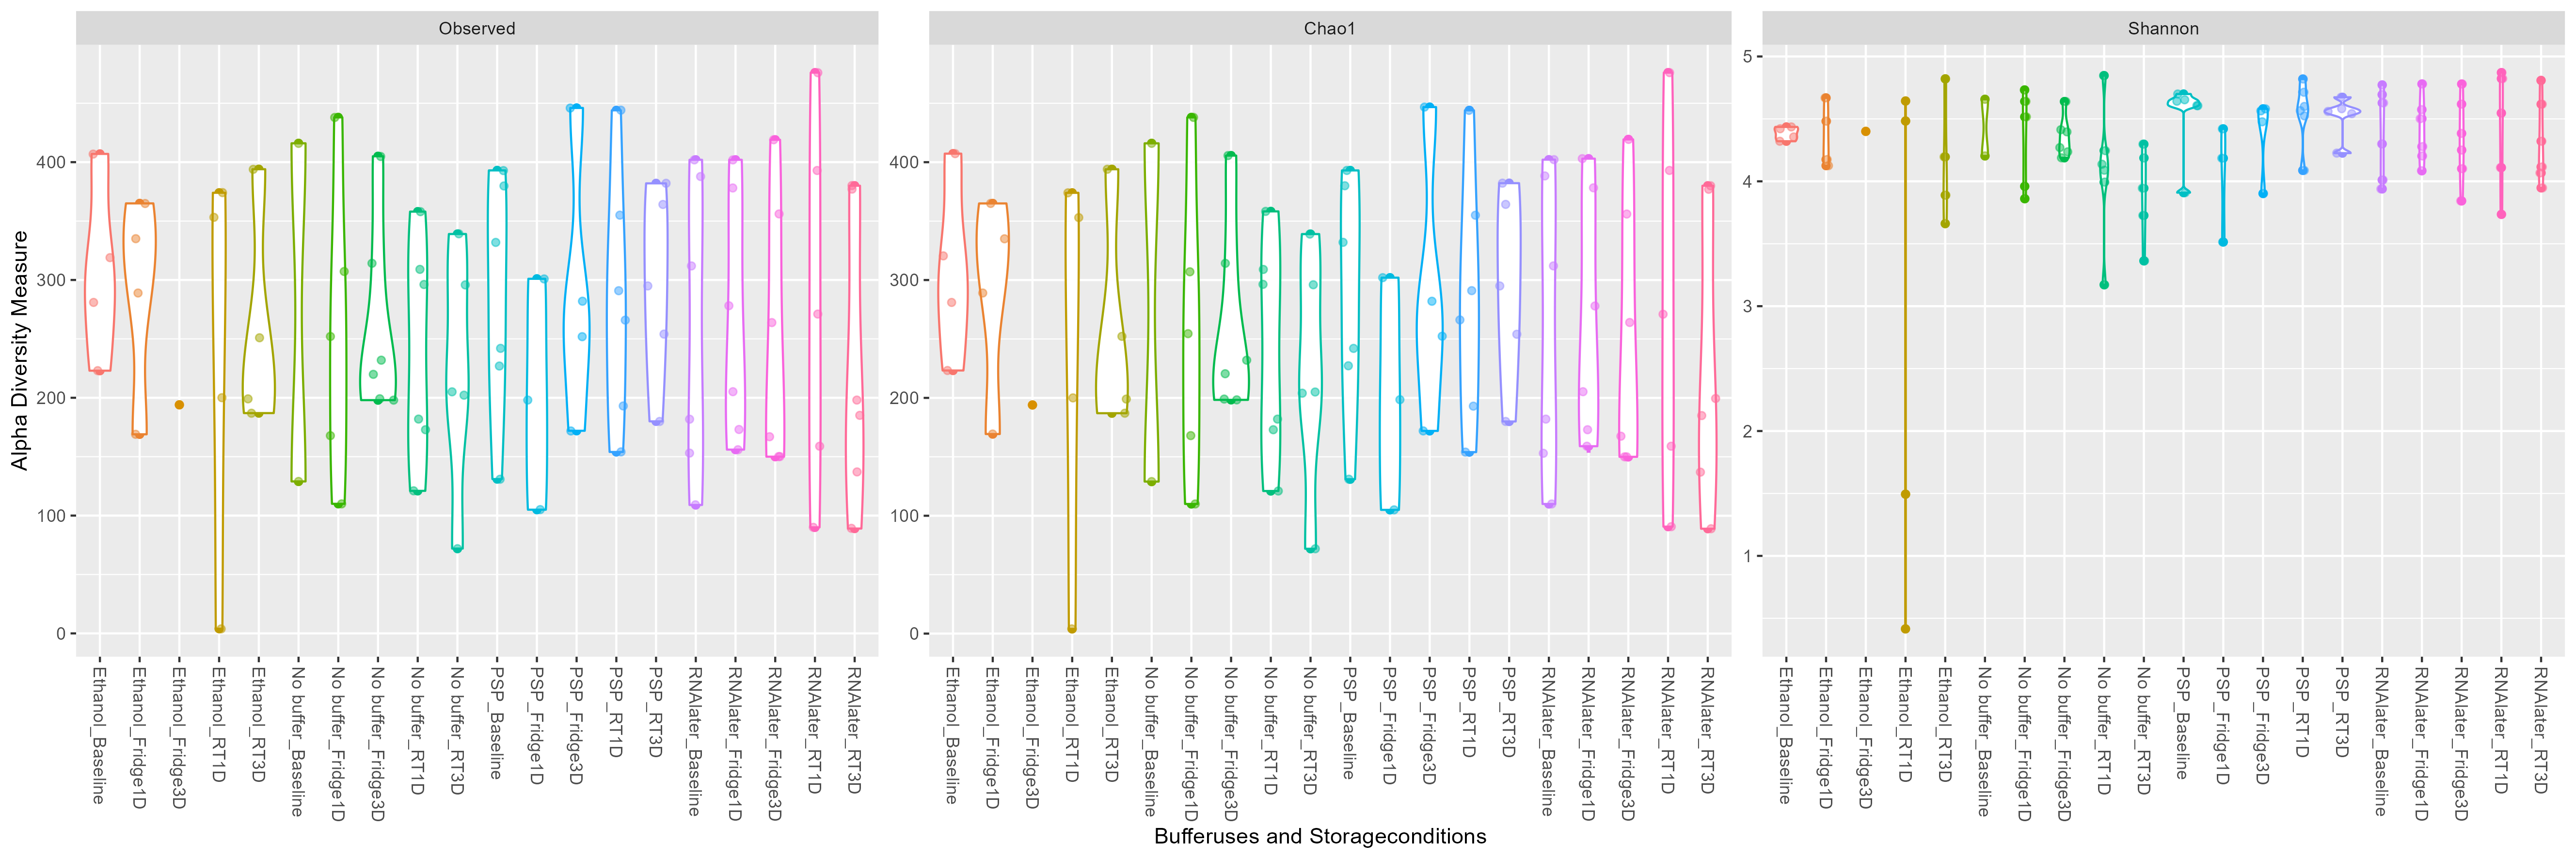
10.2.5 E: Buffer and participant
#Create buffer and participant metadata column
sample_data(physeq)[,"Patientnumber_and_Bufferused"] <-
  paste0(unlist(sample_data(physeq)[,"Patientnumber"]), "_",
         unlist(sample_data(physeq)[,"Bufferused"]))
#plot
p <- plot_richness(physeq, x = "Patientnumber_and_Bufferused",
                   color="Patientnumber_and_Bufferused",
                   measures = c("Observed","Chao1","Shannon")) +
  geom_violin() +
  ggforce::geom_sina(alpha=0.5) +
   theme(legend.position="none") +
  xlab("Participant number and Bufferused")
#  geom_point(size = 3)
ggsave(plot = p,
       filename = "./figures/alpha_diversity_Bufferused_and_Patient_number.png",
       device = "png", units = "mm", height = 100, width = 200)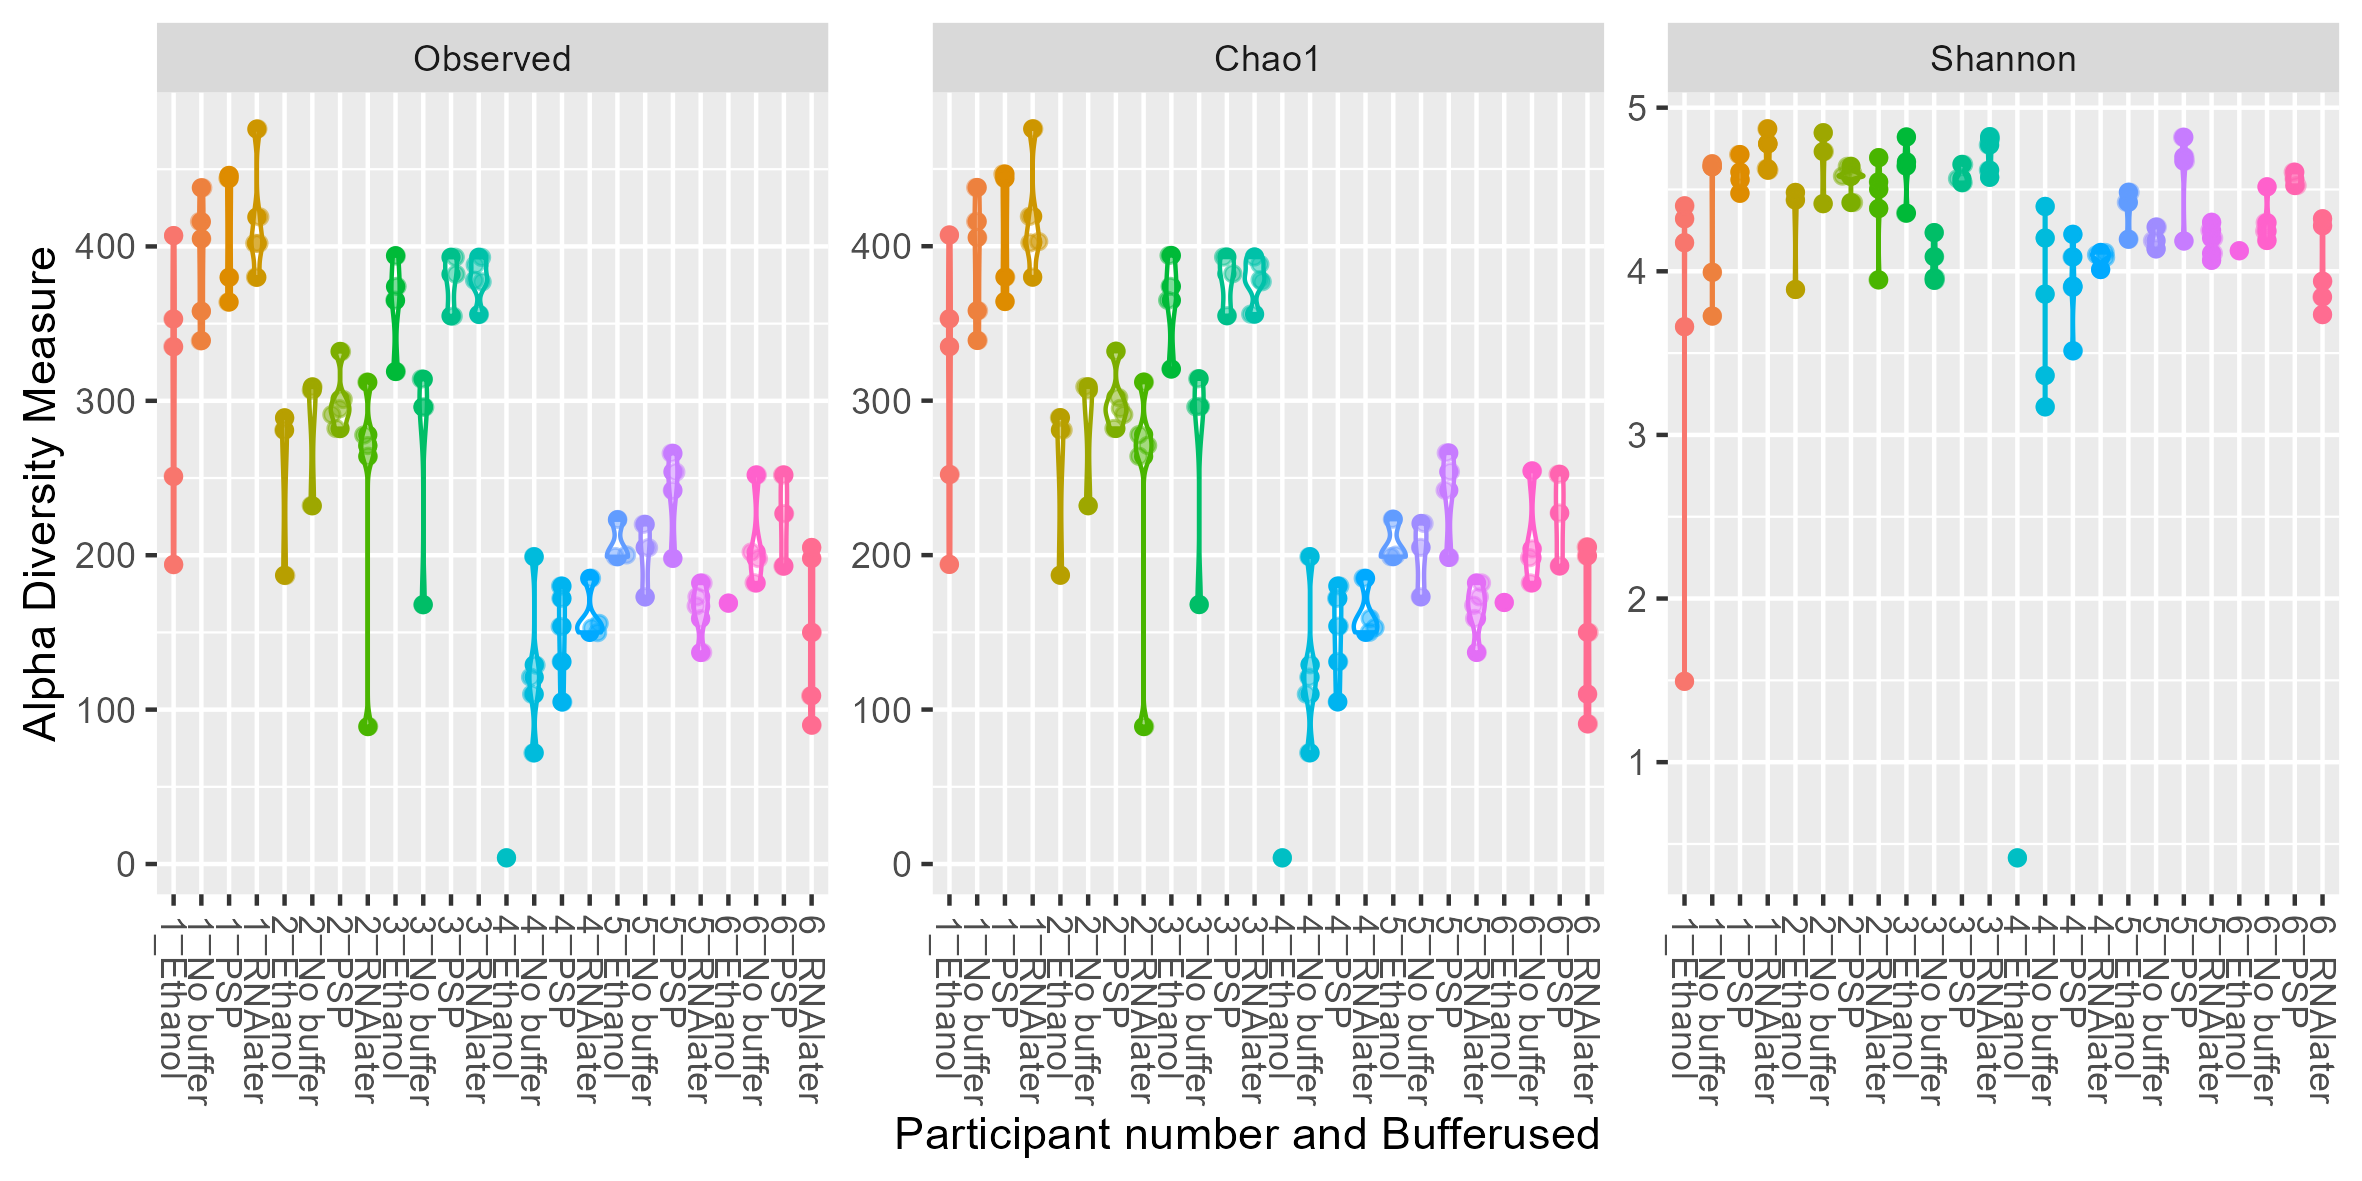
10.2.6 F: storage condition and participant
#Create buffer and participant metadata column
sample_data(physeq)[,"Patientnumber_and_Storageconditions"] <-
  paste0(unlist(sample_data(physeq)[,"Patientnumber"]), "_",
         unlist(sample_data(physeq)[,"Storageconditions"]))
#plot
p <- plot_richness(physeq, x = "Patientnumber_and_Storageconditions",
                   color="Patientnumber_and_Storageconditions",
                   measures = c("Observed","Chao1","Shannon")) +
  geom_violin() +
  ggforce::geom_sina(alpha=0.5) +
   theme(legend.position="none") +
  xlab("Participant number and Storageconditions")
#  geom_point(size = 3)
ggsave(plot = p,
       filename = "./figures/alpha_diversity_Storageconditions_and_Patient_number.png",
       device = "png", units = "mm", height = 100, width = 250)